 Wishing all of our Friends and Clients a Happy Thanksgiving!
0 Comments
 QMS Performance and TrendsThe trending of QMS performance is one of those subjects that comes up repeatedly. It is a frequent topic that arises in both the internal audits we perform, as well as during Certification Body (CB) audits we attend for ISO 9001:2015 certification, surveillance and/or re-certification. Before we jump too quickly into the topic of what QMS trends are and how they’re analyzed, it’s important to note that ISO 9001:2015 makes only one reference to the analysis of trends, as part of the requirement for Management Review Inputs (9.3.2). Per ISO 9001:2015 (9.3.2(c)), “information on the performance and effectiveness of the quality management system, including trends”, must be addressed for the following:
While this does not limit the analysis of trends to only Management Reviews, it is important to understand that the actual requirement specifically refers to the above seven items. The organization should feel free however, to analyze any other trends as necessary, and at any time of their choosing, to suit their specific business needs. What Is a Trend? In simplest terms, a trend is the general direction in which something is developing or changing. In this context, direction refers to “performance over time”, such as week-to-week, month-to-month, year-to-year. Rather than just looking at a result at a single point in time, we’re now able to see periods where QMS performance is trending upwards, downwards, or even trendless periods. Trend analysis may also be used to forecast performance into the future, if no action is taken. As for the period under consideration (weeks, months years, etc.), ISO 9001:2015 is not prescriptive on this matter, so the duration of time under review should be the one which is most appropriate for the data under consideration and your organization’s needs. While many auditors will decree this trending should cover multiple years, I don’t consider this to be an absolute, considering some data may be perishable, it’s collection (or retrieval) isn’t practical, or it may be affected by changes to either internal or external factors which may render prior data useless. 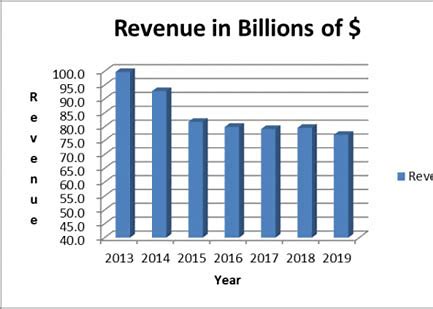 How are Trends Analyzed When the subject of analyzing trends come up, the first thing that comes to mind is Statistical Process Control (SPC), followed by an immediate groan. While trend analysis does involve statistical tools, most trend analysis can be performed using simple techniques, and common software available to most users (think Microsoft Excel). Analyzing trends does not require a Quality Engineer, or a “green belt”, “yellow belt” “black belt”, or any other color belt of the six-sigma variety. Basic computer skills are usually adequate. As for specific methods to be used, ISO 9001:2015 leaves a lot of room, as again, there’s no prescriptive requirement established here either. Trend lines, run charts, control charts, etc. are good when starting out, but keep in mind, by visualizing data in different ways, we’re able to uncover hidden or hard to understand tendencies that may otherwise go unnoticed. 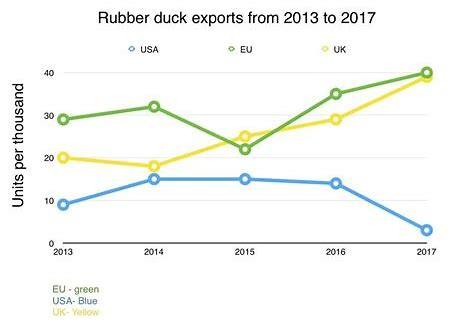  Wishing all of our Friends and Clients a Happy Veterans Day!
 Performance Indicators and KPI’s In an earlier blog post, I gave a few examples of performance indicators, as well as described the relationship between performance indicators and Key Performance Indicators (KPI’s). The distinguishing feature between these two, is whether the performance indicator under consideration is relevant to the to the strategic outcomes determined by the organization. The take-away from all this being, all KPI’s are performance indicators, but not all performance indicators are KPI’s. We monitor and measure constantly (or at least we should), but the resulting data may, or may not, be directly relevant to the achievement of our strategic goals. Determining Effectiveness Performance indicators, regardless of whether they’re considered a KPI or not, can only successfully be used to determine the performance and the effectiveness of the QMS if a criterion for effectiveness has been determined. This effectiveness criteria is not necessarily an improvement goal, but rather is used to indicate the extent to which planned activities are realized and planned results are achieved. For example, if a manufacturing process has a rework rate of 2.5%, but an effectiveness criterion of 5%, we can say that the process under consideration is “effective” (2.5% < 5%); it has achieved planned results. In this example, a rework rate of 2.5% is not an improvement goal, but rather it indicates that our expectations have been met, and the process works as intended. Quality Objectives Improvement goals, on the other hard, are realized through the process of establishing, planning and achieving quality objectives. To understand the relationship between performance indicators, KPI’s and Quality Objectives, remember that performance indicators reflect the performance of a process, function, activity, etc., while objectives are tools used to promote improvement of the Quality Management System at a strategic, tactical or operational level. Taking the above example further, if our manufacturing process has a rework rate of 2.5%, but an effectiveness criterion of 5%, we can say that the process under consideration is “effective” (2.5% < 5%); it has achieved planned results. In contrast, a process may have a rework rate of 2.5%, but we want to improve that rate down to 1.65%, we now have the basis for a quality objective. Note also, that the results of the performance indicator (2.5%), the effectiveness criteria (5%), and the quality objective (1.65%) may all exist in the same space, at the same time. Conclusion Simply put, performance indicators do just as the name implies; they indicate the performance of a process or activity, against established effectiveness criteria. Key Performance Indicators (KPI) indicate the performance of a process or activity that is key to the organization’s business strategy. Quality Objectives reflect an improved level of performance desired by the organization.
While the relationship between KPI's and Quality Objectives should be fairly intuitive, most organizations have only so many resources to spread around. We can't improve everything at once, and improvements in some areas provide little or no return. Just like every performance indicator is not a KPI, every KPI does not require a corresponding quality objective. |
Our ISO 9001 Blog
Information, thoughts and periodic updates from MAS Solutions. Please Like or Share this page if you find the content useful, so we'll know to keep posting. Enjoy! Archives
April 2020
Categories
All
|
 RSS Feed